Single-cell pipeline
Last updated: 2025-04-14
Checks: 6 1
Knit directory: KODAMA-Analysis/
This reproducible R Markdown analysis was created with workflowr (version 1.7.1). The Checks tab describes the reproducibility checks that were applied when the results were created. The Past versions tab lists the development history.
The R Markdown is untracked by Git. To know which version of the R
Markdown file created these results, you’ll want to first commit it to
the Git repo. If you’re still working on the analysis, you can ignore
this warning. When you’re finished, you can run
wflow_publish to commit the R Markdown file and build the
HTML.
Great job! The global environment was empty. Objects defined in the global environment can affect the analysis in your R Markdown file in unknown ways. For reproduciblity it’s best to always run the code in an empty environment.
The command set.seed(20240618) was run prior to running
the code in the R Markdown file. Setting a seed ensures that any results
that rely on randomness, e.g. subsampling or permutations, are
reproducible.
Great job! Recording the operating system, R version, and package versions is critical for reproducibility.
Nice! There were no cached chunks for this analysis, so you can be confident that you successfully produced the results during this run.
Great job! Using relative paths to the files within your workflowr project makes it easier to run your code on other machines.
Great! You are using Git for version control. Tracking code development and connecting the code version to the results is critical for reproducibility.
The results in this page were generated with repository version 5f5ac63. See the Past versions tab to see a history of the changes made to the R Markdown and HTML files.
Note that you need to be careful to ensure that all relevant files for
the analysis have been committed to Git prior to generating the results
(you can use wflow_publish or
wflow_git_commit). workflowr only checks the R Markdown
file, but you know if there are other scripts or data files that it
depends on. Below is the status of the Git repository when the results
were generated:
Ignored files:
    Ignored:    .RData
    Ignored:    .Rhistory
    Ignored:    .Rproj.user/

Untracked files:
    Untracked:  KODAMA.svg
    Untracked:  analysis/singlecell_datamatrix.Rmd
    Untracked:  analysis/singlecell_seurat.Rmd
    Untracked:  code/Acinar_Cell_Carcinoma.ipynb
    Untracked:  code/Adenocarcinoma.ipynb
    Untracked:  code/Adjacent_normal_section.ipynb
    Untracked:  code/DLFPC_preprocessing.R
    Untracked:  code/DLPFC - BANKSY.R
    Untracked:  code/DLPFC - BASS.R
    Untracked:  code/DLPFC - BAYESPACE.R
    Untracked:  code/DLPFC - Nonspatial.R
    Untracked:  code/DLPFC - PRECAST.R
    Untracked:  code/DLPFC_comparison.R
    Untracked:  code/DLPFC_results_analysis.R
    Untracked:  code/MERFISH - BANKSY.R
    Untracked:  code/MERFISH - BASS.R
    Untracked:  code/MERFISH - BAYESPACE.R
    Untracked:  code/MERFISH - Nonspatial.R
    Untracked:  code/MERFISH - PRECAST.R
    Untracked:  code/MERFISH_comparison.R
    Untracked:  code/MERFISH_results_analysis.R
    Untracked:  code/VisiumHD-CRC.ipynb
    Untracked:  code/VisiumHDassignment.py
    Untracked:  code/deep learning code DLPFC.R
    Untracked:  code/save tiles.py
    Untracked:  data/Annotations/
    Untracked:  data/DLFPC-Br5292-input.RData
    Untracked:  data/DLFPC-Br5595-input.RData
    Untracked:  data/DLFPC-Br8100-input.RData
    Untracked:  data/DLPFC-general.RData
    Untracked:  data/MERFISH-input.RData
    Untracked:  data/trajectories.RData
    Untracked:  data/trajectories_VISIUMHD.RData
    Untracked:  output/BANSKY-results.RData
    Untracked:  output/BASS-results.RData
    Untracked:  output/BayesSpace-results.RData
    Untracked:  output/CRC-image.RData
    Untracked:  output/CRC-image2.RData
    Untracked:  output/CRC.png
    Untracked:  output/CRC2.png
    Untracked:  output/CRC7.png
    Untracked:  output/CRC8.png
    Untracked:  output/CRC_boxplot.png
    Untracked:  output/CRC_boxplot.svg
    Untracked:  output/CRC_boxplot2.svg
    Untracked:  output/CRC_linee.svg
    Untracked:  output/DL.RData
    Untracked:  output/DLFPC-All-2.RData
    Untracked:  output/DLFPC-All.RData
    Untracked:  output/DLFPC-Br5292.RData
    Untracked:  output/DLFPC-Br5595.RData
    Untracked:  output/DLFPC-Br8100.RData
    Untracked:  output/DLFPC-variablesXdeeplearning.RData
    Untracked:  output/DLPFC-BANSKY-results.RData
    Untracked:  output/DLPFC-BASS-results.RData
    Untracked:  output/DLPFC-BayesSpace-results.RData
    Untracked:  output/DLPFC-Nonspatial-results.RData
    Untracked:  output/DLPFC-PRECAST-results.RData
    Untracked:  output/DLPFC_all_cluster.svg
    Untracked:  output/DLPFCpathway.RData
    Untracked:  output/Figure 1 - boxplot.pdf
    Untracked:  output/Figure 2 - DLPFC 10.pdf
    Untracked:  output/Figures/
    Untracked:  output/KODAMA-results.RData
    Untracked:  output/KODAMA_DLPFC_All_original.svg
    Untracked:  output/KODAMA_DLPFC_Br5595.svg
    Untracked:  output/KODAMA_DLPFC_Br5595_slide.svg
    Untracked:  output/Loupe.csv
    Untracked:  output/MERFISH-BANSKY-results.RData
    Untracked:  output/MERFISH-BASS-results.RData
    Untracked:  output/MERFISH-BayesSpace-results.RData
    Untracked:  output/MERFISH-KODAMA-results.RData
    Untracked:  output/MERFISH-Nonspatial-results.RData
    Untracked:  output/MERFISH-PRECAST-results.RData
    Untracked:  output/MERFISH.RData
    Untracked:  output/Nonspatial-results.RData
    Untracked:  output/Prostate-GSEA.csv
    Untracked:  output/Prostate-KODAMA.RData
    Untracked:  output/Prostate-trajectory.csv
    Untracked:  output/Prostate.RData
    Untracked:  output/VisiumHD-RNA.RData
    Untracked:  output/VisiumHD-genes.pdf
    Untracked:  output/VisiumHD.RData
    Untracked:  output/boh.svg
    Untracked:  output/desmoplastic_distance_carcinoma.csv
    Untracked:  output/image.RData
    Untracked:  output/pp.RData
    Untracked:  output/pp2.RData
    Untracked:  output/pp3.RData
    Untracked:  output/pp4.RData
    Untracked:  output/pp5.RData
    Untracked:  output/prostate1.svg
    Untracked:  output/prostate2.svg
    Untracked:  output/prostate3.svg
    Untracked:  output/subclusters1.csv
    Untracked:  output/subclusters2.csv
    Untracked:  output/subclusters3.csv
    Untracked:  output/tight_boundary.geojson
    Untracked:  output/trajectory.csv

Unstaged changes:
    Deleted:    analysis/D1.Rmd
    Deleted:    analysis/DLPFC-12.Rmd
    Deleted:    analysis/DLPFC-4.Rmd
    Modified:   analysis/DLPFC.Rmd
    Deleted:    analysis/DLPFC1.Rmd
    Deleted:    analysis/DLPFC10.Rmd
    Deleted:    analysis/DLPFC2.Rmd
    Deleted:    analysis/DLPFC3.Rmd
    Deleted:    analysis/DLPFC4.Rmd
    Deleted:    analysis/DLPFC5.Rmd
    Deleted:    analysis/DLPFC6.Rmd
    Deleted:    analysis/DLPFC7.Rmd
    Deleted:    analysis/DLPFC8.Rmd
    Deleted:    analysis/DLPFC9.Rmd
    Deleted:    analysis/Du1.Rmd
    Deleted:    analysis/Du10.Rmd
    Deleted:    analysis/Du11.Rmd
    Deleted:    analysis/Du12.Rmd
    Deleted:    analysis/Du13.Rmd
    Deleted:    analysis/Du14.Rmd
    Deleted:    analysis/Du15.Rmd
    Deleted:    analysis/Du16.Rmd
    Deleted:    analysis/Du17.Rmd
    Deleted:    analysis/Du18.Rmd
    Deleted:    analysis/Du19.Rmd
    Deleted:    analysis/Du2.Rmd
    Deleted:    analysis/Du20.Rmd
    Deleted:    analysis/Du3.Rmd
    Deleted:    analysis/Du4.Rmd
    Deleted:    analysis/Du5.Rmd
    Deleted:    analysis/Du6.Rmd
    Deleted:    analysis/Du7.Rmd
    Deleted:    analysis/Du8.Rmd
    Deleted:    analysis/Du9.Rmd
    Modified:   analysis/Giotto.Rmd
    Modified:   analysis/MERFISH.Rmd
    Deleted:    analysis/MERFISH1a (copy).Rmd
    Deleted:    analysis/MERFISH1a.Rmd
    Deleted:    analysis/MERFISH1b (copy).Rmd
    Deleted:    analysis/MERFISH1b.Rmd
    Deleted:    analysis/MERFISH2a (copy).Rmd
    Deleted:    analysis/MERFISH2a.Rmd
    Deleted:    analysis/MERFISH2b (copy).Rmd
    Deleted:    analysis/MERFISH2b.Rmd
    Deleted:    analysis/MERFISH3a (copy).Rmd
    Deleted:    analysis/MERFISH3a.Rmd
    Deleted:    analysis/MERFISH3b (copy).Rmd
    Deleted:    analysis/MERFISH3b.Rmd
    Deleted:    analysis/MERFISH4a (copy).Rmd
    Deleted:    analysis/MERFISH4a.Rmd
    Deleted:    analysis/MERFISH4b (copy).Rmd
    Deleted:    analysis/MERFISH4b.Rmd
    Modified:   analysis/Prostate.Rmd
    Deleted:    analysis/STARmap.Rmd
    Modified:   analysis/Seurat.Rmd
    Deleted:    analysis/Simulation.Rmd
    Deleted:    analysis/Single-cell.Rmd
    Modified:   analysis/SpatialExperiment.Rmd
    Modified:   analysis/VisiumHD.Rmd
    Modified:   code/VisiumHD_CRC_download.sh
    Deleted:    data/Pathology.csv
    Deleted:    data/merfish.Rmd
    Deleted:    data/vis.R
Note that any generated files, e.g. HTML, png, CSS, etc., are not included in this status report because it is ok for generated content to have uncommitted changes.
There are no past versions. Publish this analysis with
wflow_publish() to start tracking its development.
Single-cell data
The data set from Tasic et al. encompasses 23,822 cells from adult mouse cortex, split by the authors into 133 clusters with strong hierarchical organisation. A standard preprocessing pipeline consisting of sequencing depth normalisation, feature selection, log-transformation, and reducing the dimensionality to 50 PCs was applied as described by Kobak & Berens in The art of using t-SNE for single-cell transcriptomics.
library(irlba)
library(KODAMA)
library(KODAMAextra)
Tutorial
Download the data from here and unpack. Direct links: VISp, ALM. To get the information about cluster colors and labels (sample_heatmap_plot_data.csv), open the interactive data browser, go to “Sample Heatmaps”, click “Build Plot!” and then “Download data as CSV”.
ta=read.csv("../singlecell_tutorial/sample_heatmap_plot_data.csv")
rownames(ta)=ta[,1]
VIS=read.csv("../singlecell_tutorial/mouse_VISp_2018-06-14_exon-matrix.csv")
ALM=read.csv("../singlecell_tutorial/mouse_ALM_2018-06-14_exon-matrix.csv")
The intron and exon data are merged, and the zeros columns are removed.
data=t(cbind(ALM,VIS))
colnames(data)=as.character(data[1,])
data=data[-1,]
ii=intersect(rownames(data),rownames(ta))
data=data[ii,]
data=data[,colSums(data)!=0]
near.zero.counts=colMeans(data<32)
The data are normalized and converted to log ratios.
temp=data
temp[temp<=32]=NA
temp=log2(temp)
m=colMeans(temp,na.rm = TRUE)
y=exp(-1.5*(m-6.56))+0.02
data=data[,which(near.zero.counts>y)]
su=rowSums(data)
data=((data/su)*10^6)*median(su)
data=log2(data+1)
The first 50 principal components are calculated.
data.scaled=scale(data)
pca_results <- irlba(A = data.scaled, nv = 50)
pca <- pca_results$u %*% diag(pca_results$d)
jj=KODAMA.matrix.parallel(pca,
splitting = 100,
n.cores=12,
seed = 543210)Calculating Network
socket cluster with 12 nodes on host 'localhost'
================================================================================
Finished parallel computation
[1] "Calculation of dissimilarity matrix..."
================================================================================vis <- KODAMA.visualization(jj)
plot(vis,pch=21,bg=ta[,"cluster_color"])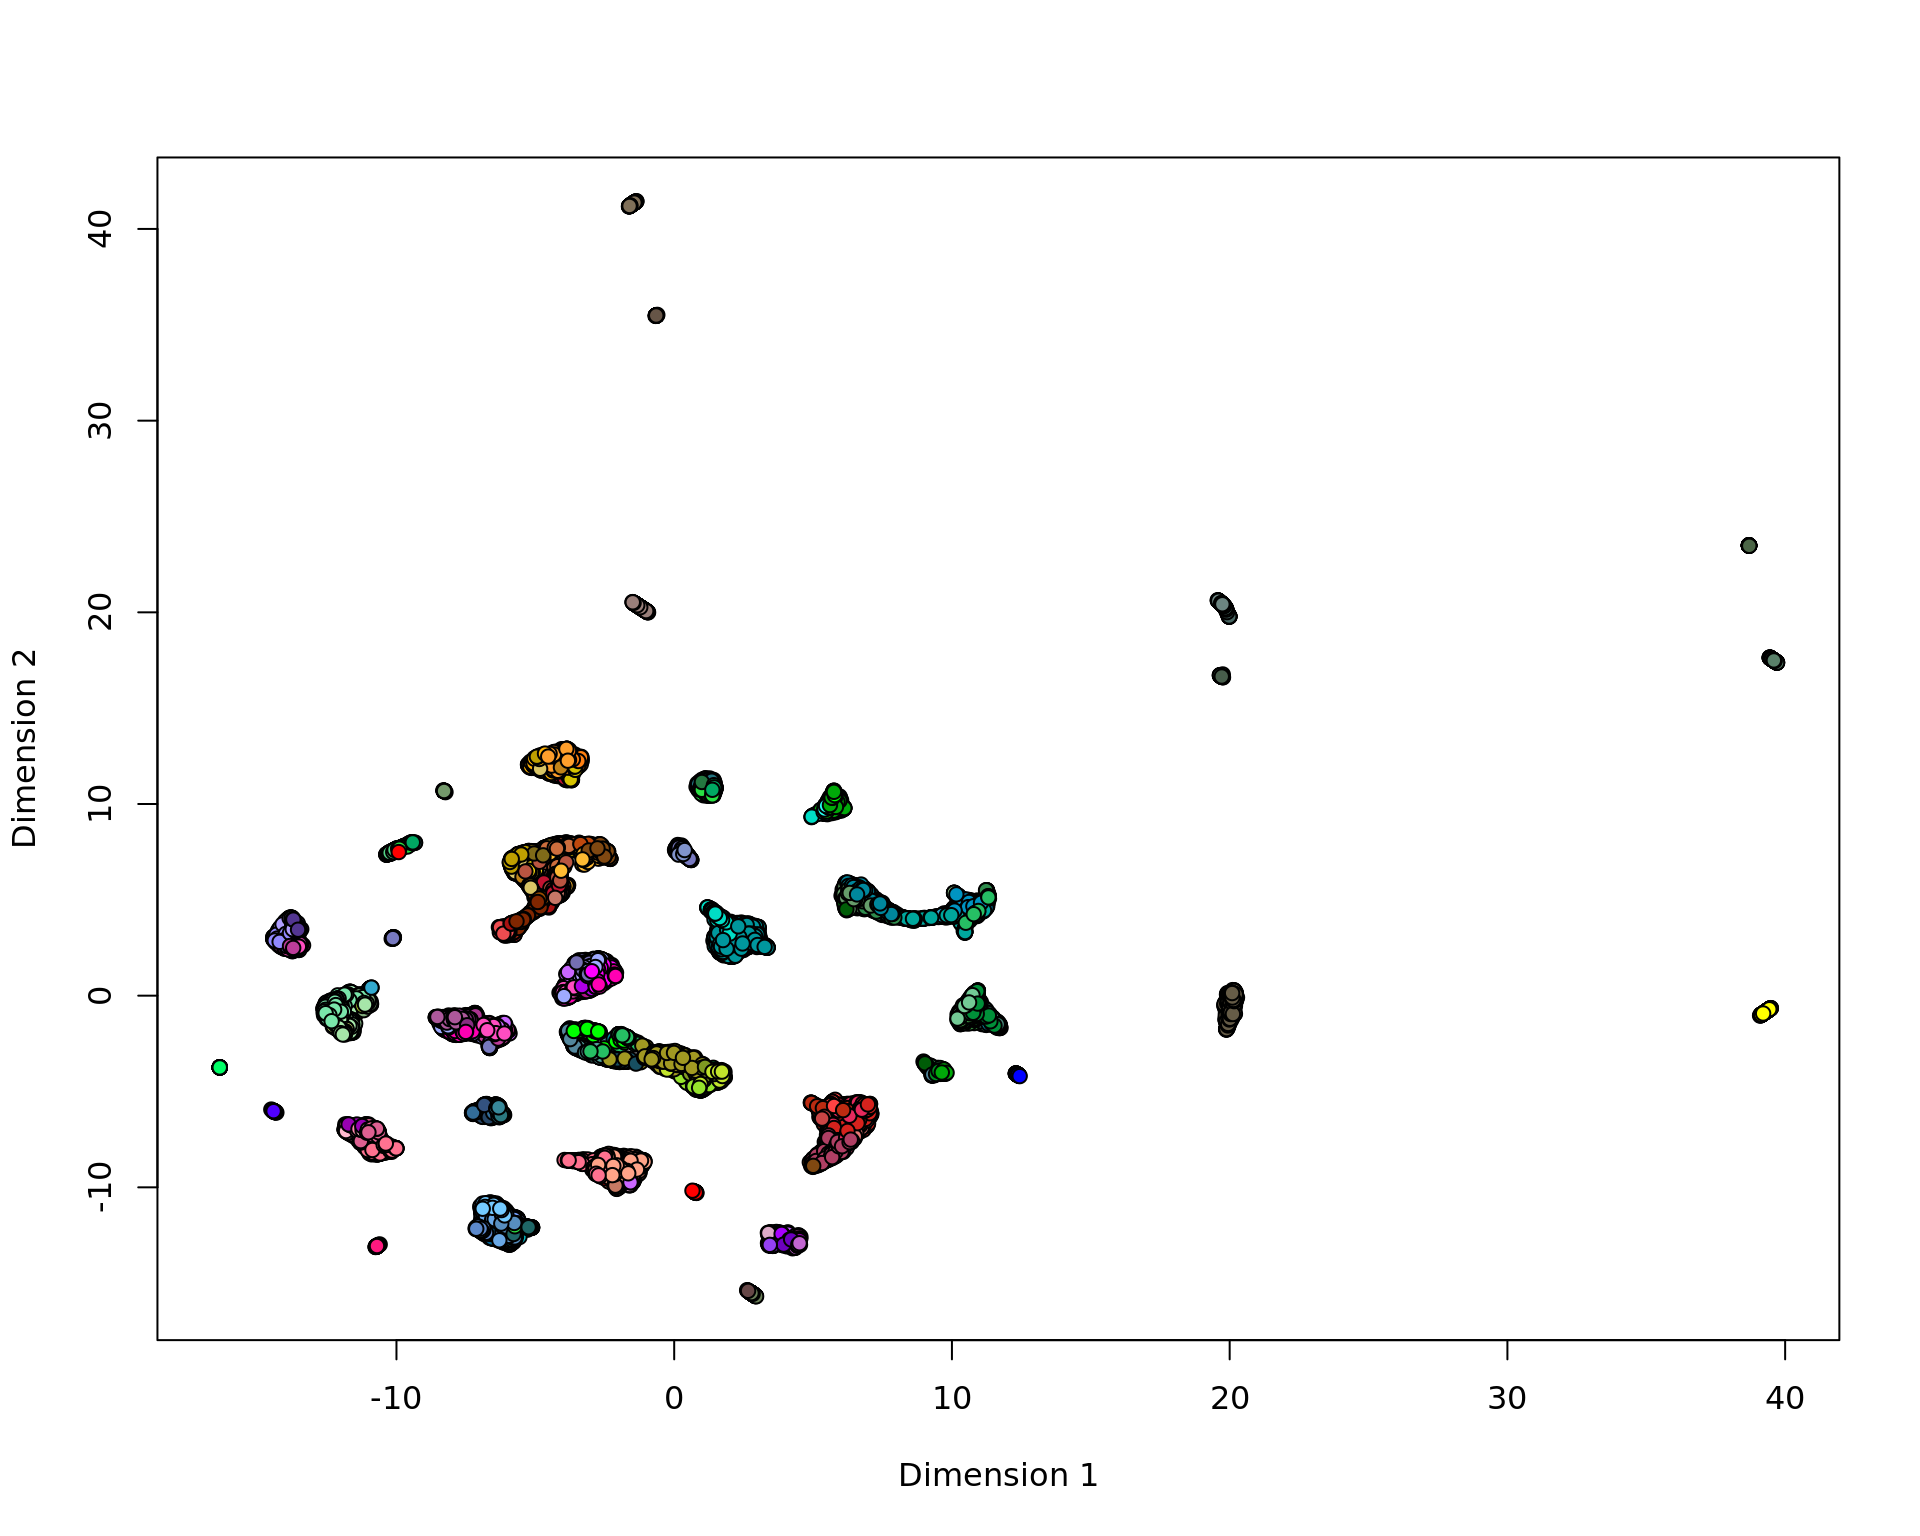
vis <- KODAMA.visualization(jj,method="t-SNE")
plot(vis,pch=21,bg=ta[,"cluster_color"])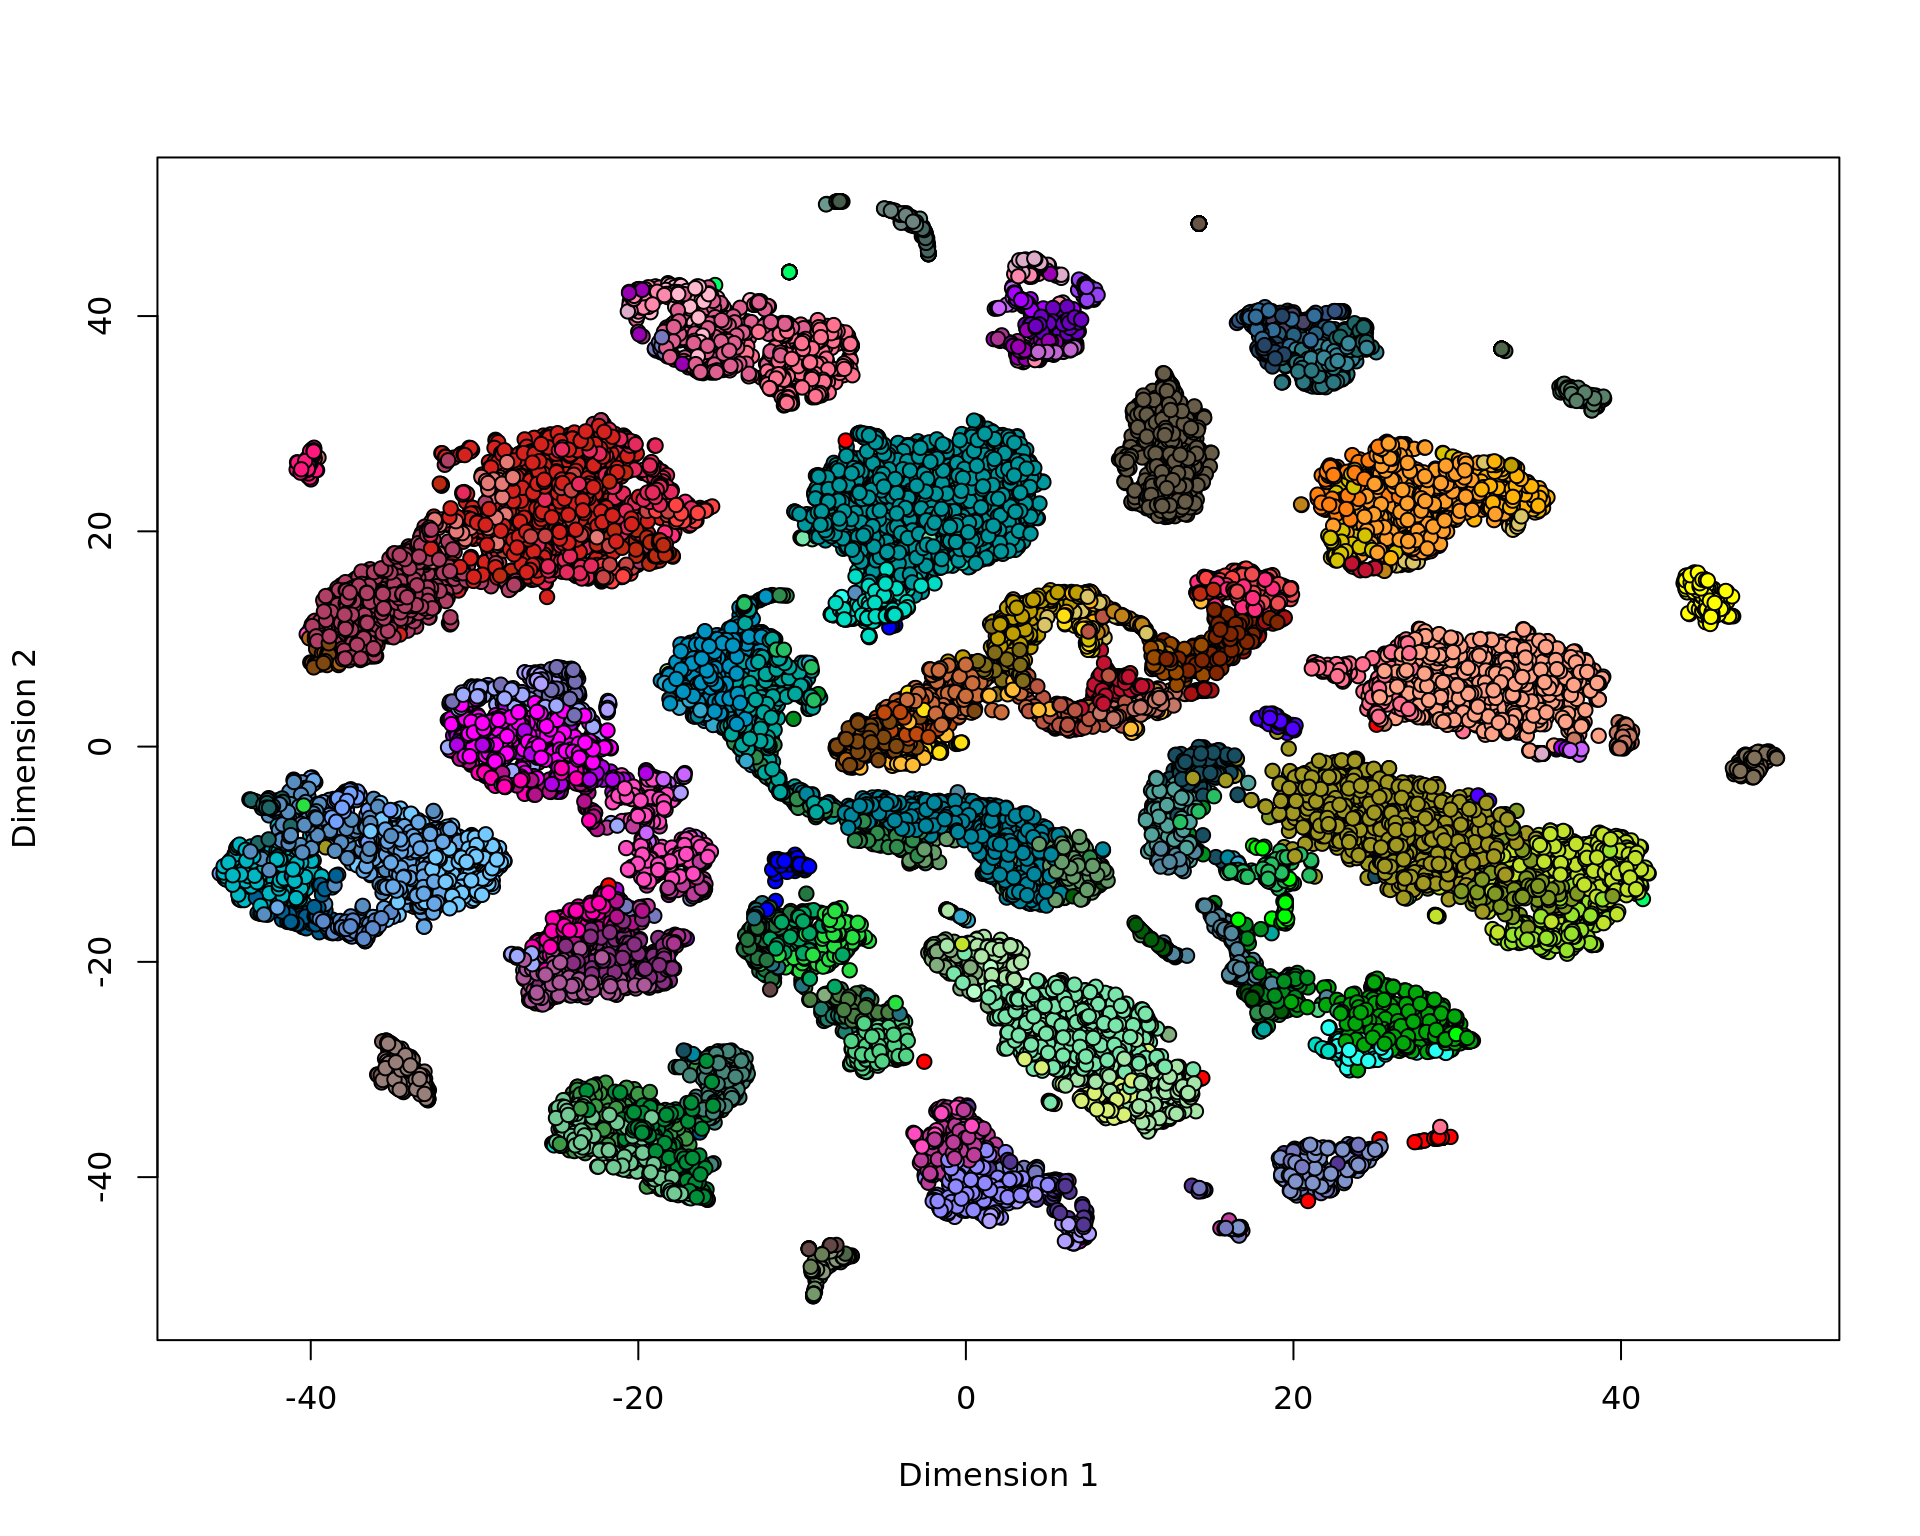
sessionInfo()R version 4.4.3 (2025-02-28)
Platform: x86_64-pc-linux-gnu
Running under: Ubuntu 20.04.6 LTS
Matrix products: default
BLAS: /usr/lib/x86_64-linux-gnu/blas/libblas.so.3.9.0
LAPACK: /usr/lib/x86_64-linux-gnu/lapack/liblapack.so.3.9.0
locale:
[1] LC_CTYPE=en_US.UTF-8 LC_NUMERIC=C
[3] LC_TIME=en_US.UTF-8 LC_COLLATE=en_US.UTF-8
[5] LC_MONETARY=en_US.UTF-8 LC_MESSAGES=en_US.UTF-8
[7] LC_PAPER=en_US.UTF-8 LC_NAME=C
[9] LC_ADDRESS=C LC_TELEPHONE=C
[11] LC_MEASUREMENT=en_US.UTF-8 LC_IDENTIFICATION=C
time zone: Etc/UTC
tzcode source: system (glibc)
attached base packages:
[1] parallel stats graphics grDevices utils datasets methods
[8] base
other attached packages:
[1] KODAMAextra_1.2 e1071_1.7-16 doParallel_1.0.17 iterators_1.0.14
[5] foreach_1.5.2 KODAMA_3.0 umap_0.2.10.0 Rtsne_0.17
[9] minerva_1.5.10 irlba_2.3.5.1 Matrix_1.7-3 workflowr_1.7.1
loaded via a namespace (and not attached):
[1] sass_0.4.9 tcltk_4.4.3 class_7.3-23 stringi_1.8.7
[5] lattice_0.22-7 digest_0.6.37 magrittr_2.0.3 evaluate_1.0.3
[9] grid_4.4.3 fastmap_1.2.0 rprojroot_2.0.4 jsonlite_2.0.0
[13] processx_3.8.6 whisker_0.4.1 RSpectra_0.16-2 misc3d_0.9-1
[17] doSNOW_1.0.20 ps_1.9.0 promises_1.3.2 httr_1.4.7
[21] codetools_0.2-20 jquerylib_0.1.4 cli_3.6.4 rlang_1.1.5
[25] cachem_1.1.0 yaml_2.3.10 tools_4.4.3 httpuv_1.6.15
[29] Rnanoflann_0.0.3 reticulate_1.42.0 vctrs_0.6.5 R6_2.6.1
[33] png_0.1-8 proxy_0.4-27 lifecycle_1.0.4 git2r_0.33.0
[37] stringr_1.5.1 fs_1.6.5 pkgconfig_2.0.3 callr_3.7.6
[41] pillar_1.10.1 bslib_0.9.0 later_1.4.1 glue_1.8.0
[45] Rcpp_1.0.14 xfun_0.51 tibble_3.2.1 rstudioapi_0.17.1
[49] knitr_1.50 snow_0.4-4 htmltools_0.5.8.1 rmarkdown_2.29
[53] compiler_4.4.3 getPass_0.2-4 askpass_1.2.1 openssl_2.3.2